PPFAS Q1 FY27 Results: AUM Up 38%, Profit Rises 35%
· 5 min read · Written by the BuyUnlistedShares desk. Information only, not investment advice.
PPFAS's Q1 FY27 numbers: AUM up 38%, profit up 35%. But dig a layer deeper and the picture shifts: market share stayed flat, the SIP book stopped growing, and revenue yield broke a three-year uptrend. Here's what the headline growth is hiding.
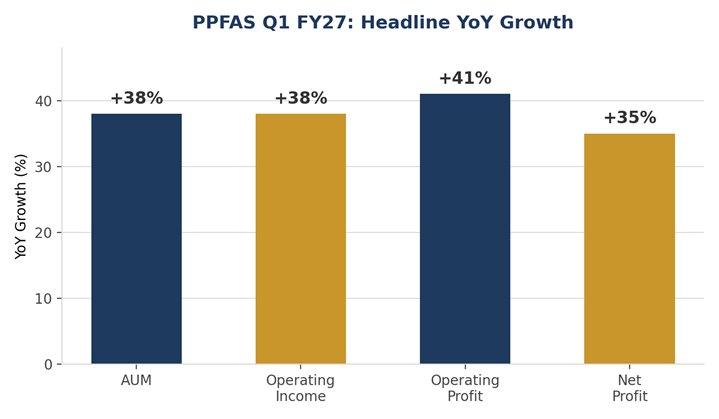
PPFAS Mutual Fund's parent company, Parag Parikh Financial Advisory Services (PPFAS), reported its results for the quarter ended June 2026 (Q1 FY27) in mid-August. Assets under management (AUM) were up 38% year-on-year and net profit up 35%. The post also sets out the underlying metrics — market share, SIP flows, and revenue yield.
This piece walks through what grew, what stalled, and what to watch in the quarters ahead. It is a plain summary of publicly reported figures, not a recommendation to buy, hold, or sell any security.
The Headline Numbers
Q1 FY27 figures on an absolute basis:
 Beyond the headline four, the quarter also showed roughly 90% of assets sourced from retail investors, customer acquisition running at close to three times the broader industry pace, and a distribution network of about 59,000 partners. Digital transactions reportedly made up close to 90% of activity, and non-equity AUM grew faster than equity AUM — a modest diversification away from pure equity dependence.
Where the Story Gets More Complicated
Growth in AUM and profit is easy to celebrate, but a few structural indicators moved in the opposite direction during the same quarter, and together they explain why this result reads differently once you look past the top line.
1. AUM Growth Was Largely Market-Driven
Part of the 38% rise in AUM tracks broader equity market appreciation over the trailing year rather than fresh investor money. AUM growth from market appreciation is different from growth through net inflows.
2. Market Share Stayed Flat
Despite the AUM growth, PPFAS's overall share of industry AUM was largely unchanged during the quarter. In other words, the rest of the mutual fund industry grew at a broadly similar pace.
3. Revenue Yield Broke a Three-Year Uptrend
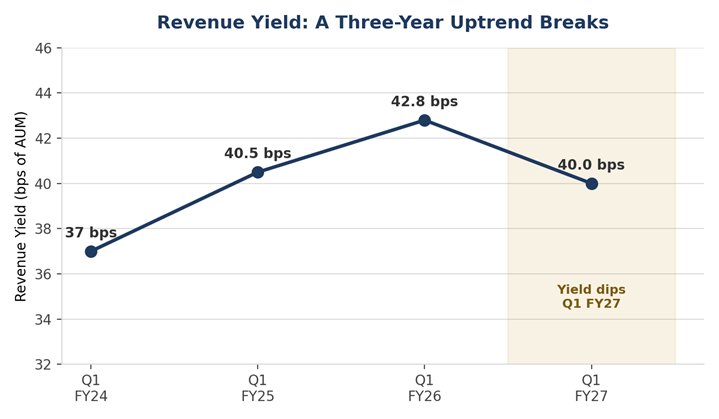
Revenue yield — how much revenue is earned per rupee of average AUM — had been climbing steadily for roughly three years. In Q1 FY27, it came in lower, dipping to around 40 basis points from the prior year's level. A lower yield alongside rising AUM can reflect a shifting asset mix (more debt or lower-fee products in the mix) or fee compression.
4. The SIP Book Stopped Growing
The monthly SIP book held roughly flat at about ₹1,590 crore during the quarter, with no visible sequential growth.
5. Dilution Is a Quiet Drag on Per-Share Metrics
As an unlisted company, PPFAS's basic share count (around 79.1 lakh shares) understates the fully diluted picture once outstanding employee stock options are included (closer to 88.4 lakh shares) — an embedded dilution of nearly 12%. This doesn't affect the underlying business, but per-share profit and book-value figures are higher on a basic-share basis than on a fully diluted basis.
B-30 Reach
Another metric is geographic reach beyond India's largest 30 cities (B-30). PPFAS's B-30 AUM share rose to about 24.44% in June 2026 from roughly 23.60% a year earlier.
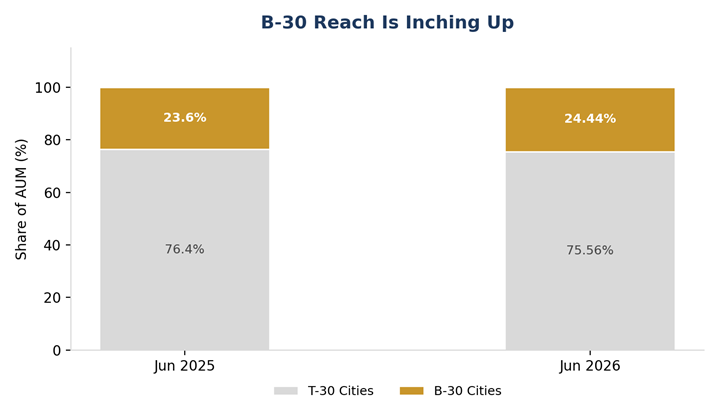
Fig 3: B-30 (beyond top-30 cities) share of AUM.
What to Watch Next Quarter
Three specific data points, due with the next quarterly disclosure, should help clarify whether Q1 FY27 was a brief pause or the start of a slower phase:
● Whether revenue yield stabilises closer to 40 basis points or continues to slip.
● Whether market share shows a clear, sustained improvement rather than staying flat.
Frequently Asked Questions
1. What was PPFAS's AUM growth in Q1 FY27?
PPFAS's overall assets under management grew 38% year-on-year in the quarter ended June 2026. Much of this growth came from equity market appreciation rather than fresh money flowing in, which is an important distinction when reading the headline number.
2. How much did PPFAS's profit grow in Q1 FY27?
Net profit rose 35% year-on-year to about ₹131 crore. Operating income was up 38% and operating profit rose 41%, both slightly ahead of the bottom line, while return on equity came in above 41% for the quarter.
3. What happened to market share, revenue yield and the SIP book in the quarter?
Market share stayed flat, revenue yield slipped after three years of gains, and the SIP book stopped growing in the same quarter.
4. What happened to PPFAS's SIP book in Q1 FY27?
The monthly SIP book plateaued at roughly ₹1,590 crore during the quarter, showing no visible sequential growth.
5. What is revenue yield and why did it break its trend?
Revenue yield measures how much revenue an asset manager earns for every rupee of AUM it manages, expressed in basis points. PPFAS's yield had been on a three-year uptrend but came in lower in Q1 FY27, even as AUM crossed new milestones, suggesting a shift in asset mix or fee realisation.
6. Did PPFAS's market share change during the quarter?
Reported market share was largely flat during Q1 FY27, meaning the industry-wide mutual fund pool grew at a similar pace to PPFAS's own AUM, rather than PPFAS visibly gaining ground on peers.
7. What is PPFAS's B-30 exposure and how did it move?
B-30 refers to AUM sourced from cities beyond the top 30 by mutual fund penetration. PPFAS's B-30 share rose to roughly 24.44% of AUM in June 2026 from about 23.60% a year earlier, a modest improvement in geographic reach.
8. Is PPFAS a listed company?
No. PPFAS (Parag Parikh Financial Advisory Services) is not listed on a stock exchange. Its shares trade only in the unlisted or pre-IPO market, where pricing is less standardised and liquidity is thinner than for exchange-listed stocks.
9. What should investors watch in the next quarter?
Three data points are generally seen as the ones that will clarify whether Q1 FY27 was a one-off pause or the start of a slower phase: whether the SIP book moves off its current plateau, whether revenue yield stabilises, and whether market share shows a clear improvement.
10. Is this blog investment advice?
No. This article is for general informational and educational purposes only. It summarises publicly available quarterly performance data and does not constitute investment, financial, or legal advice. Readers should do their own research or consult a qualified, registered advisor before making any financial decision.
Disclaimer:
This is written for educational and informational purposes only. Nothing here constitutes investment advice or a recommendation to buy or sell securities. All data is sourced from publicly available information. Investments in securities markets are subject to market risks — please read all offer documents carefully before investing.